
For-Profit Colleges: Awful or Abused
A Response from Industry Veteran Mary Lyn Hammer
Ms. Mary Lyn Hammer has released her response to Cato Institute’s event titled “For-Profit Colleges: Awful or Abused?” that was held November 16, 2016at Cato Institute in DC.
Ms. Hammer’s response documents the U.S. Department of Education’s (ED) history of inaccurate public reporting of numerous databases about sector-level performance in higher education. ED’s inaccuracies have harmed the reputations of the for-profit sector while exaggerating the performance of public and private nonprofit sectors. Her response includes her analysis of the 2016 Official FY 2013 Cohort Default Rate which has continued ED’s harmful pattern of inaccurate reporting.
All information contained in Ms. Hammer’s response has been verified in Independent Accountant Reports conducted by Kaiser & Carolin, PC.
For-Profit Colleges: Awful or Abused?
Hosted by CATO Institute
November 16, 2016
Verified Evidence Proves That For-Profit Colleges Have Been Targeted
An analysis by Mary Lyn Hammer, a cohort default rate industry expert, comparing numerous U.S. Department of Education databases to its press releases and briefings shows a pattern of misreporting that has harmed the for-profit sector while it has enhanced performance of public and private nonprofit sectors.
Verified in Independent Accountant Reports by Kaiser & Carolin, PC
Cohort Default Rate Data Does Not Match the
Department of Education’s Publicly-Released Cohort Default Rates
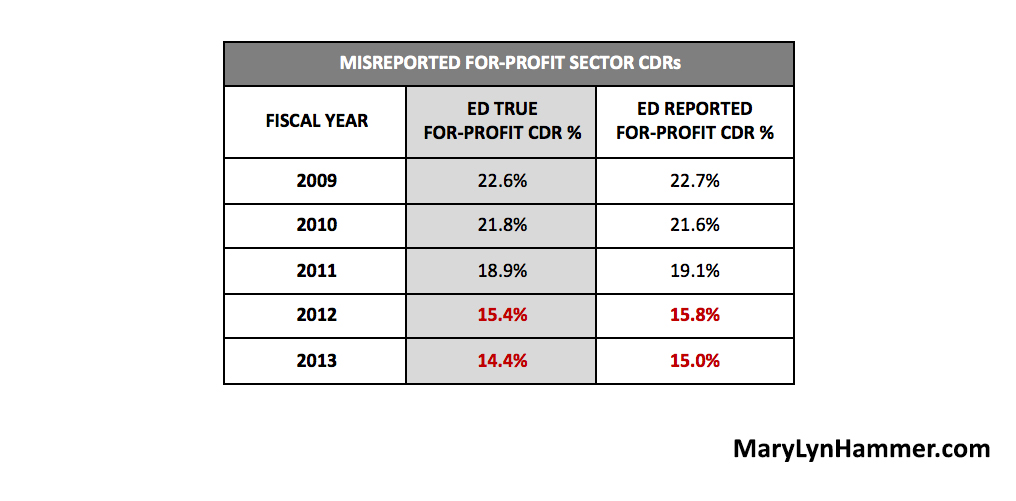
An analysis of 3-year cohort default rates (“CDR”) for years 2009 to 2013 shows that the numbers and rates released by U.S. Department of Education (“ED”) through its official briefings did not match the actual CDR numbers and rates in ED’s data. The CDR rates and numbers released (and touted) by ED were inflated for for-profit colleges, lowered for public colleges, and for 2012 and 2013, lowered for private nonprofit colleges (“NFP”). From this analysis, it would seem that ED manipulated CDR data to fit a bias and political agenda against for-profit colleges.
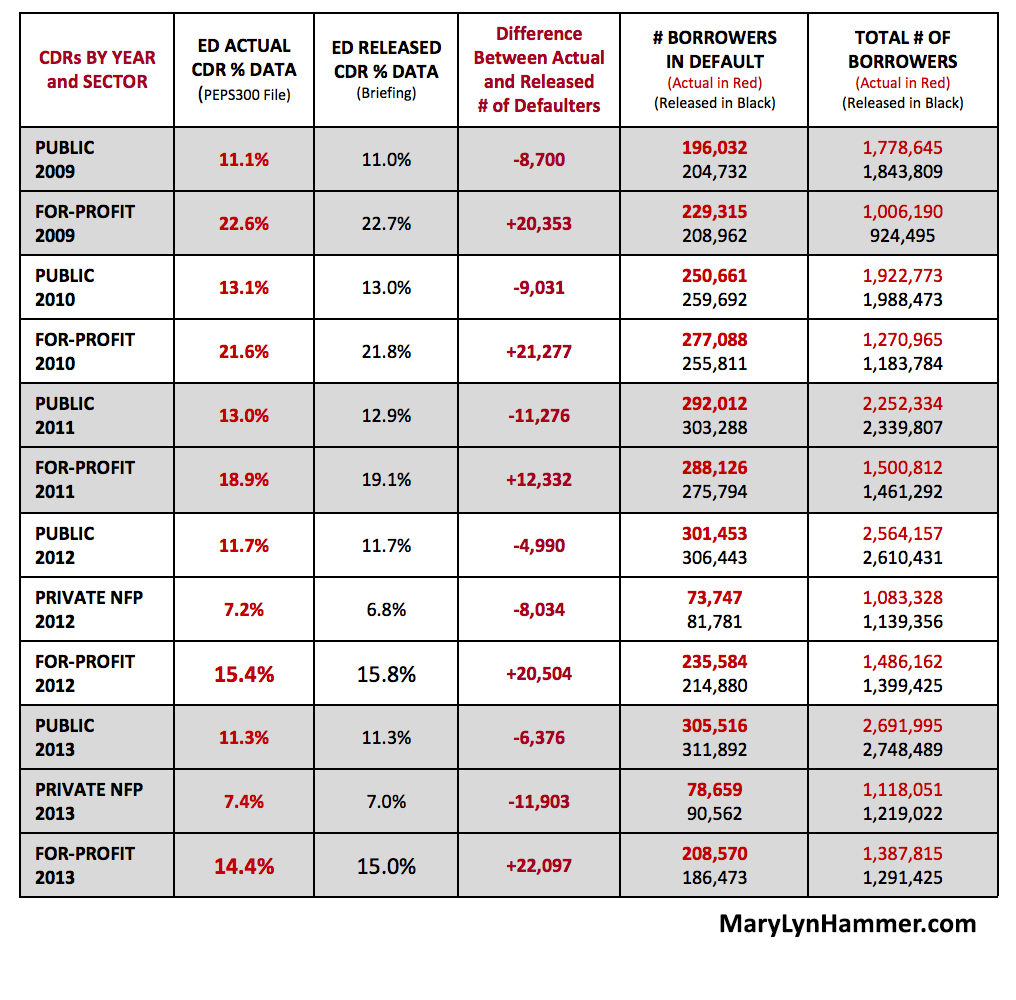
ED’s manipulation of the FY 2012 and FY 2013 CDR rates has been the most egregious and appears to have been done to gain public support for gainful employment and other regulations targeting the for-profit sector.
The CDR data “released” by ED gave the impression that public colleges outperformed for-profit colleges. This story was then promoted in the media by ED and the Obama Administration. Unfortunately, the story does not match the true results.
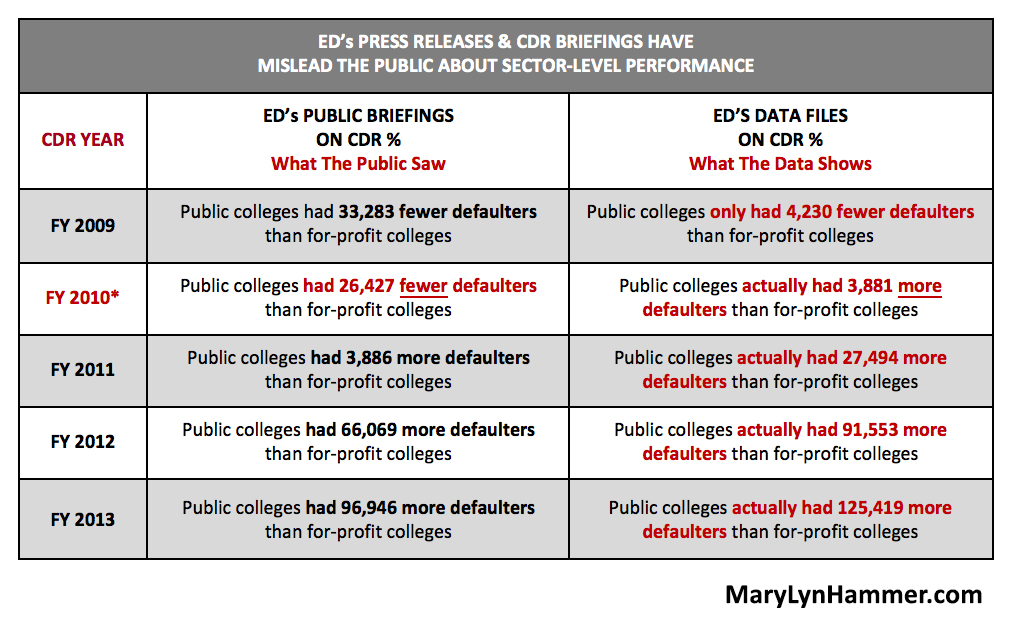
* NOTE: This was when ED was pushing public support of Gainful Employment regulations that primarily apply to for-profit college programs.
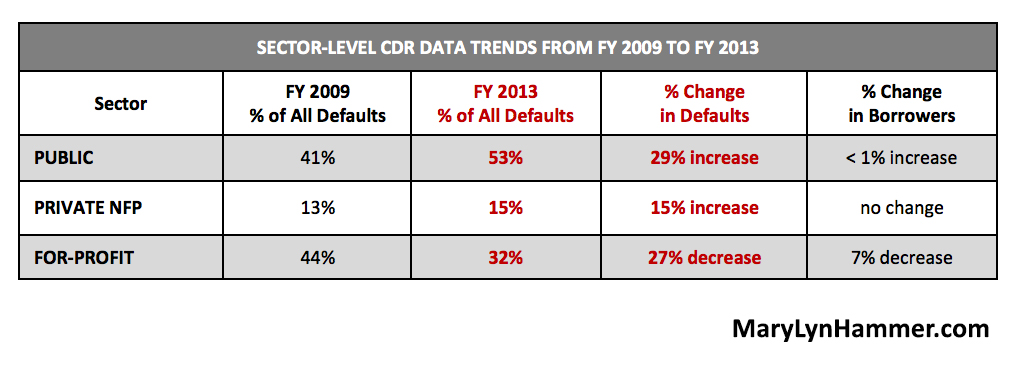
The TRUTH is that the for-profit sector is the ONLY sector whose percentage of total defaulters declined over the last five (5) years. Both public and the private NFP saw significant increases in their percent of the total defaulters. Relative to each sectors’ number of borrowers entering repayment, the for-profit sector reduced its CDR rates while public and private NFP sectors saw increased CDR rates.
The flawed CDR information that ED repeatedly issued in press releases and media briefings incorrectly made the for-profit sector’s CDR performance look worse and the public sector’s CDR performance look better than ED’s actual data.
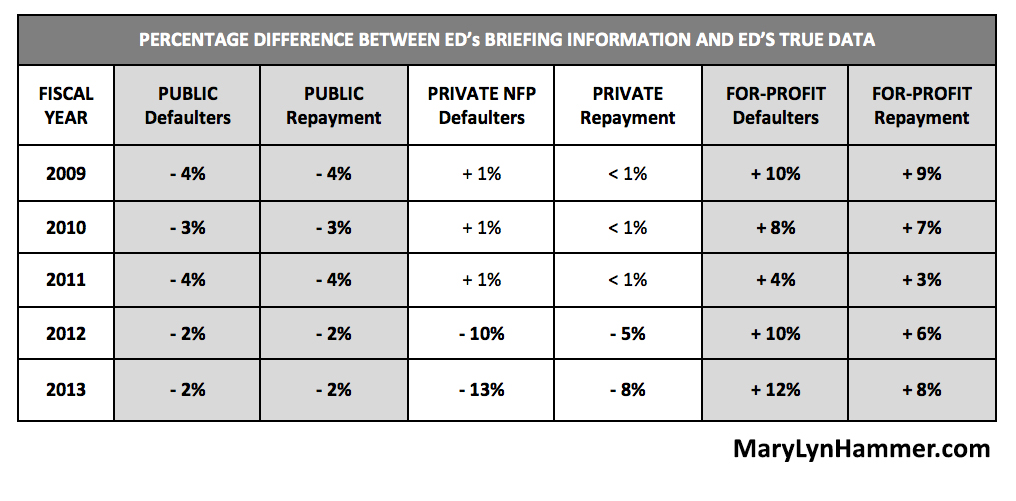
The difference between ED’s publicly released “official” CDRs and ED’s true CDR data for for-profit college shows that the rates released by ED for the for-profit sector were higher than ED’s true data. The consequence of releasing inflated for-profit sector CDRs was that the public, students, and lawmakers were misled about the for-profit sector’s true CDR performance.
What ED Doesn’t Want You to Know About For-Profit CDRs
Colleges must have CDRs below a certain level to participate in federal financial aid programs. A college’s CDR is the percentage of students who enter repayment in a given federal fiscal year and then default before the end of the second subsequent federal fiscal year. Officials and lawmakers total the number of borrowers in default and the number of borrowers that entered repayment to produce a sector-level CDR. This methodology was chosen because it favors public colleges and private NFP colleges and does not favor for-profit college.
ED’s reporting of sector CDRs used to include the actual dollar volume of each sector’s defaults. ED stopped reporting the dollar volume of defaults years ago because the default dollar volume for public colleges and private NFP colleges was dramatically higher than the dollar volume of defaults at for-profit college.
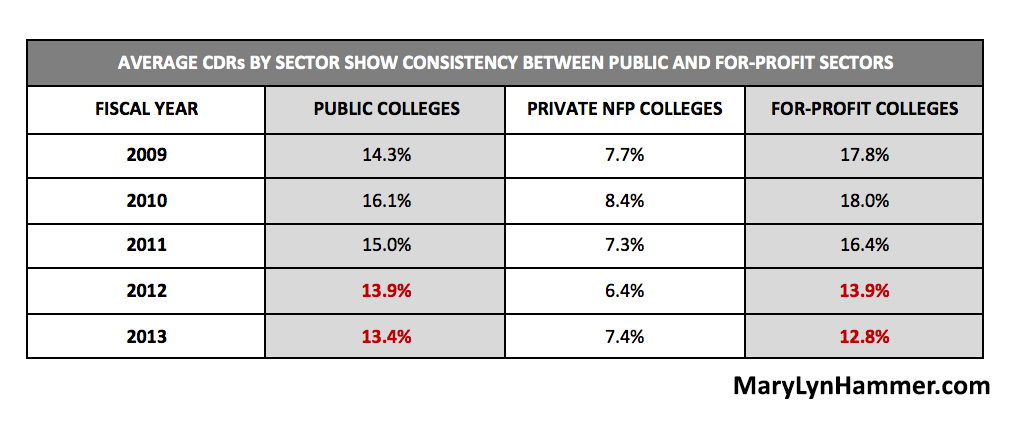
CDRs Based on an Average CDR Methodology Shows the For-Profit Sector Performs Well
When the average CDR of institutions within a sector is used, giving each institution equal weight, an interesting pattern appears and provides a more accurate picture of sector-level performance than the method ED currently uses.
Two-Thirds of For-Profit Colleges Have FY 2013 CDRs Under 15%
ED and others would like the public to believe that the for-profit colleges are unethical and leave students with debt they cannot afford. But ED’s actual data contradicts this story.
Colleges with CDRs less than 15% are considered “quality” institutions and these colleges receive regulatory benefits such as single disbursements and no 30-day disbursement delays for first-time borrowers. Today, the for-profit college sector is outperforming the public college sector on this definition of quality with average CDRs of 12.8% compared to 13.4% respectively.
The FY 2013 3-year CDRs (released in September 2016) show that two-thirds (2/3) of all for-profit college have CDRs under 15%. It’s time to admit that not all for-profit colleges not bad!
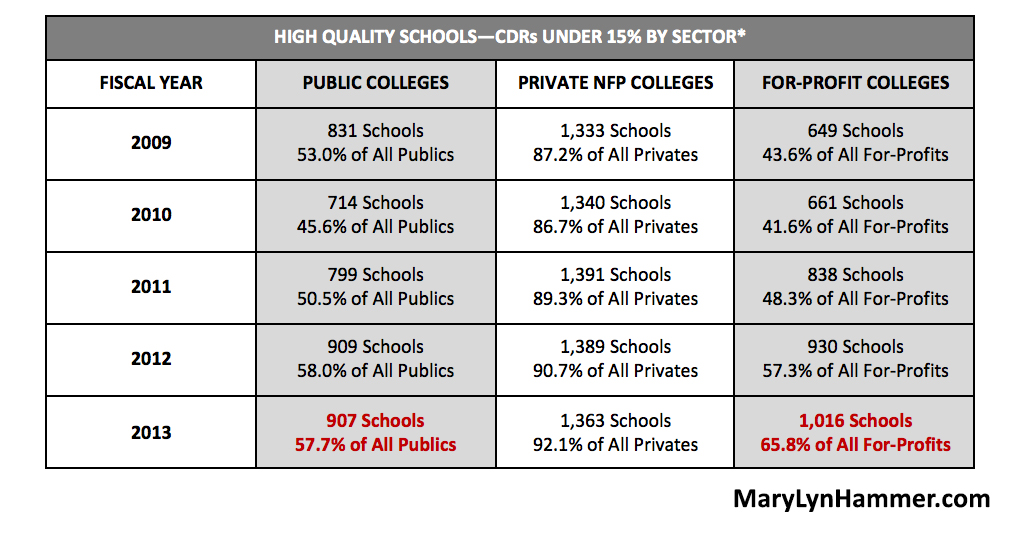
*Percentages are based on the total number of schools with a CDR in ED’s PEPS300 data file for each fiscal year.
Again, the for-profit sector outperformed the public sector in both the number and percent of high quality schools with FY 2013 CDRs under 15%.
There Are Very Few For-Profit Schools That Lose Title IV Eligibility Based On CDRs
ED and others want people to believe that many for-profit colleges have poor CDRs; are being kicked out of federal aid programs because of high CDRs; and leave students with debt they can’t afford. ED’s true data contradicts this story too.
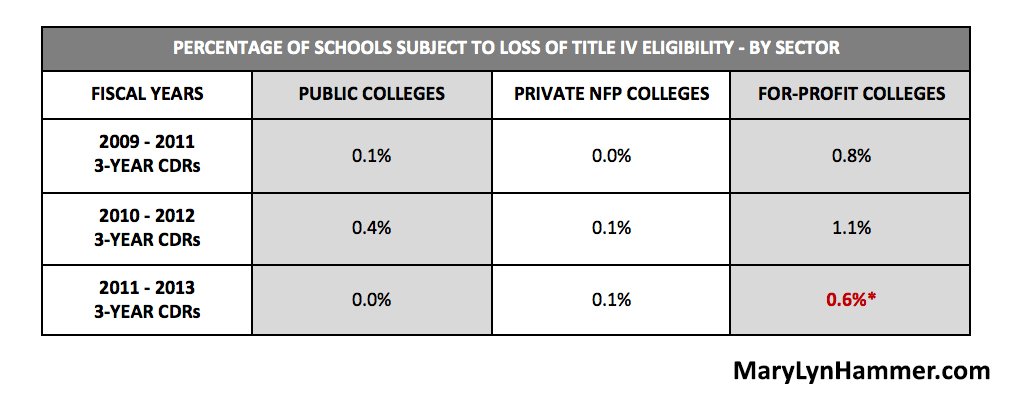
* Included in this percentage are for-profit schools that ED has approved for Economically Disadvantaged Appeals and other appeals which mean these schools are not actually subject to sanctions. ED’s inclusion of these schools tarnishes the reputation of these schools based on ED’s inaccurate reporting.
ED’s Gainful Employment Data Does Not Match Its Reporting
Beginning with FY 2011 Gainful Employment Rates (“GE”), ED’s reporting has been incomplete and inaccurate based upon ED’s true data. There are three primary GE data sets:
- FY 2011 “Streamlined” Informational Data containing data for 3,695 programs—rate data only. (DOE File: StreamlinedGE2011InformationalRates062512School)
- FY 2011 “Final” Informational Data containing data for 13,772 programs—with large amounts of data missing from these programs. (DOE File Name: GE2011InformationalRates062512FINAL)
- FY 2012 Informational Data containing data for 7,934 programs—with median debt data missing so rates cannot be verified. (DOE File Name: 2012-informational-rates033114-508)
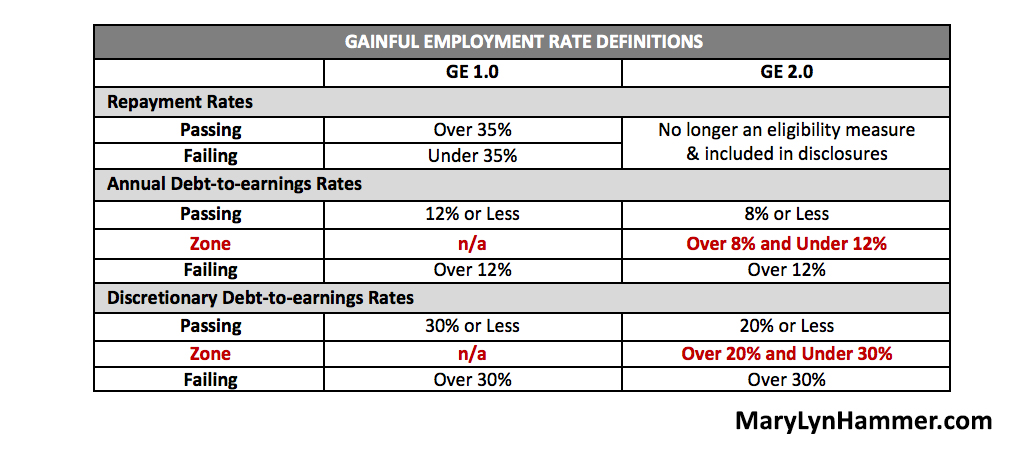
The thresholds for the original gainful employment measures (“GE 1.0”) and the second gainful employment measures (“GE 2.0”) are as follows:
FY 2011 Gainful Employment Informational Rates (June 2012)
ED’s “Final” GE data contained enough details to allow the data to be audited. . An audit of the data shows that the true GE rates were inconsistent with Informational Rates ED released to the public, media, and the investment community. The discrepancies favored public and private NFP colleges and were damaging to for-profit college.
Missing Data
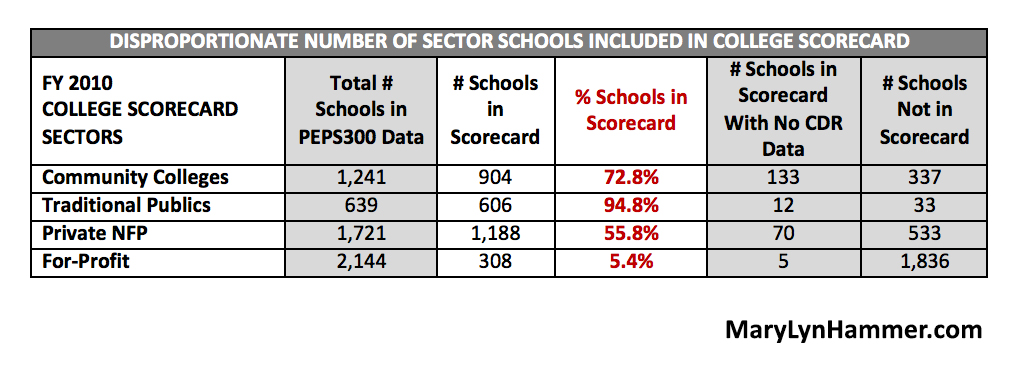
In the data ED released to the public and the media, a disproportionate number of schools from each sector were reported in the “FY 2011 Streamlined Informational Data” compared to the comprehensive “FY 2011 Final Informational Data”.
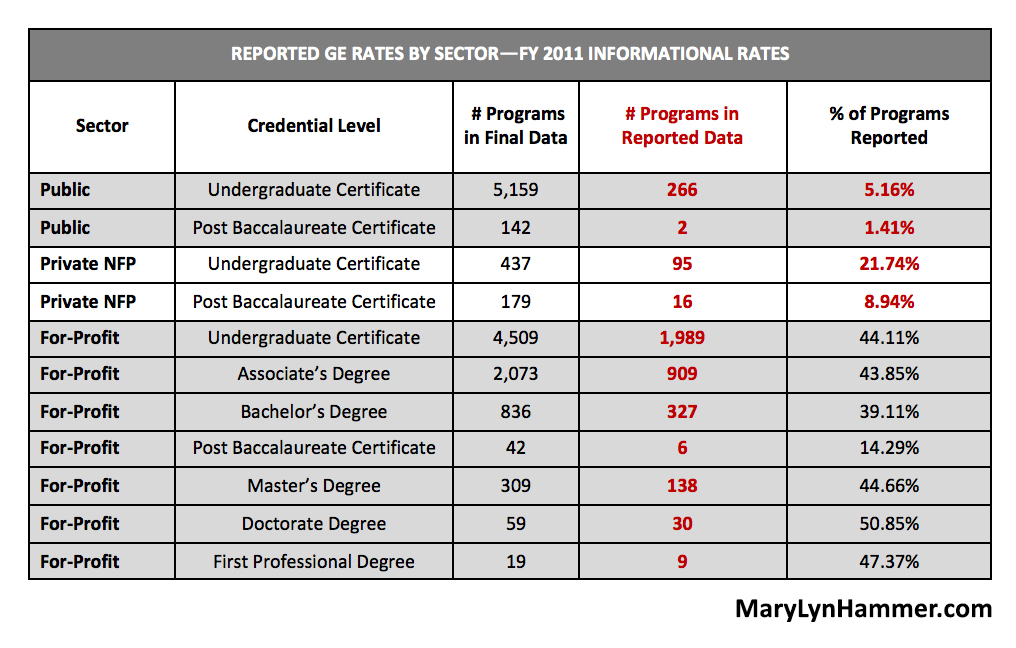
Without comprehensive and complete data, no one can know whether programs passed or failed the GE criteria. The “missing data” appears to have been intentionally removed (or not calculated) by ED resulting in data for only 5.1% of public college programs, 18.2% of private NFP programs, but 43.4% of for-profit college programs. A review of the data for programs not reported shows that:
- Several programs had all of the data available but were not reported;
- Many programs had Title IV loan amounts but did not have repayment rate information (even though they go hand-in-hand);
- Many programs had repayment rate information but the Title IV loan information was blank, zero (0), or N/A;
- Many programs had loan information and income information but debt-to-earnings rates were not calculated;
- Many programs had debt-to-earnings rate information and calculations but the loan information and repayment information was blank, zero (0), or N/A.
Inaccurate Calculations
In the comprehensive “Final” FY 2011 GE Informational Rate data, the most accurately reported ratios were the payment calculations comparing all sector programs:
- The UNDERGRADUATE program payments were consistent with the average debt amount and the defined length of repayment period.
- The POST BACCALEAUREATE program payments were similar to the payments calculated for the average debt amount and defined length of repayment period. However, the payments for the for-profit programs had the biggest discrepancy.
The payment calculations by credential levels—where for-profit schools had the only applicable programs—were inaccurately calculated too high and payments were not calculated in compliance with the original regulatory definition for 10-, 15-, and 20-year repayment schedules.
The payment schedules that should have been used are:
- 10-year Standard Repayment
- Undergraduate Certificate
- Associate’s Degree
- Post Baccalaureate Degree
- 15-year Standard Repayment
- Bachelor’s Degree
- Master’s Degree
- 20-year Standard Repayment
- Doctorate Degree
- First Professional Degree
Failing Programs
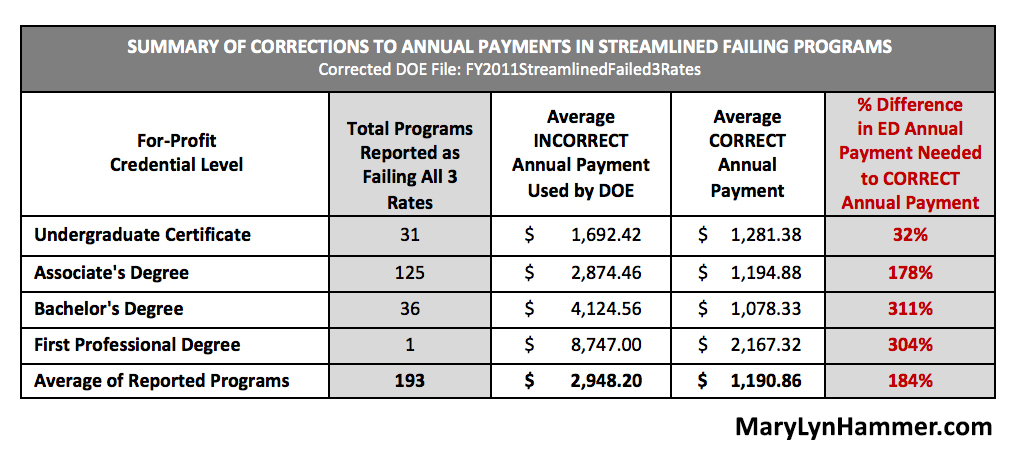
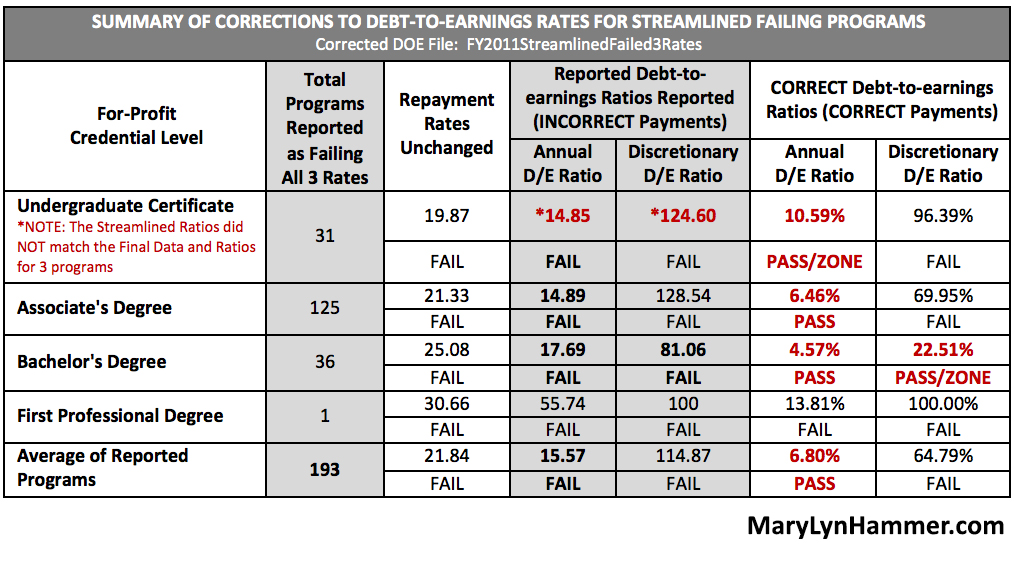
For programs identified in the FY 2011 Streamlined Data as “Failed 3 Rates” (193 for-profit programs), payments were not calculated in compliance with the regulatory definition for 10-, 15-, and 20-year repayment schedules. These rates were therefore grossly inaccurate:
When the correct repayment calculation is applied to the 193 proprietary programs that ED reported as “failing”—only 6 programs actually failed all three rates and 56 rates fell within the GE 2.0 “zone” definition.
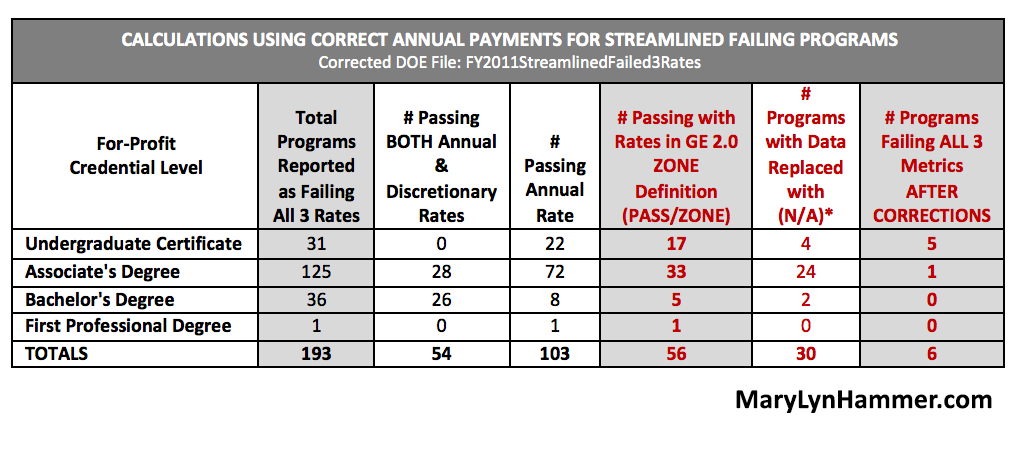 *Note: Those programs where data was replaced with “N/A” could not be verified for accuracy and are not included in the analysis as passing or failing.
Thirty (30) programs had missing data (N/A) and certain data points and rates could not be verified for accuracy. Several undergraduate certificate programs had data and rates in the final data that did not match the rates in the streamlined data.
The miscalculations for payments had a significant effect on the Debt-to-Earnings Ratios for the 193 programs ED reported as failing all 3 metrics:
ED never publicly acknowledged or corrected its press releases and statements that included egregious errors in sector-level GE performance.
The public and lawmakers have been grossly misled especially regarding the performance of for-profit programs.
There is strong evidence that ED’s definition for the “zone” and other GE criteria were established because the Department did not have the desired number of failing programs when payments were corrected. Mary Lyn Hammer personally testified at the Department’s field hearing (prior to the GE 2.0 negotiated rulemaking) about the inaccuracy of the payments and rate calculations. And then interestingly, when the ED subsequently came to the table for the first round of GE 2.0 negotiated rule-making, they came with the new “zone” definition.
ED’s “PAYE” and “REPAY” Set Up GE Programs to Fail Repayment Rates
ED’s much-publicized and promoted Pay-As-You-Earn (“PAYE” and “REPAY”) programs, in addition to other income-based repayment plans, put students into negative amortization during their first few years of repayment. Therefore, these ED repayment programs cause programs to fail the GE repayment rate thresholds. It is curious that these new repayment programs were rolled out at the same time the GE rules were being developed. These new repayment programs only require loan payments of 10% of discretionary earnings defined as the difference between your earnings and 150% of the poverty-level guidelines for your family. This requirement makes loan payments minimal and sets up a college’s GE programs to systematically fail the repayment rate criteria. While the repayment rate is no longer a program eligibility requirement (it is now a reporting requirement), the structure continues to harm the reputations primarily of for-profit college.
The PAYE program was implemented early through an Obama executive order. This executive order was issued simultaneously with the first GE rules. It would appear that the generous repayment plans were developed to produce poor repayment rates. And since the vast majority of GE programs are at for-profit college—these colleges would bear the brunt of poor GE repayment rates caused by the new repayment plans. Under standard repayment structures, most GE programs would have passing repayment rates.
Is it a coincidence that the PAYE and GE criteria were developed at the same time?
Was the PAYE program intentionally defined to make the first GE programs fail?
Were repayment rates included in GE 2.0 reporting requirements to show poor results at for-profit college?
Or was it designed to increase ED’s profits from student loans by making most or all of a student’s payment go the interest costs? Or both?
College Scorecard Fails to Accurately Report Information for All Schools
The Original College Scorecard Hosted on Whitehouse.gov
The original College Scorecard, hosted on Whitehouse.gov, was promoted as the place for students and parents to find critical comparative information on colleges.
There were numerous problems with the original Scorecard:
- The Scorecard did not contain information on all colleges. There was a disproportionate representation of schools from each sector.
- There were no schools in the Scorecard that pulled up under the following key word searches:
- Law, Legal
- Cosmetology, Salon, Beauty, Barber, Hair, or Massage
(Note that many of these same schools are those with missing data in the GE Informational Rates.)
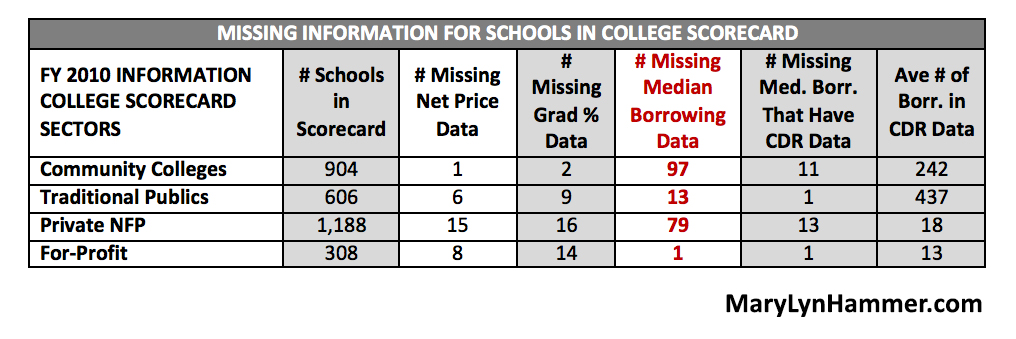
- The information in the Scorecard was often incomplete. Numerous schools listed “no data” when that data existed on ED’s College Navigator site. For example, numerous schools did not have “median borrowing data” even though the school had a default rate and a significant number of borrowers.
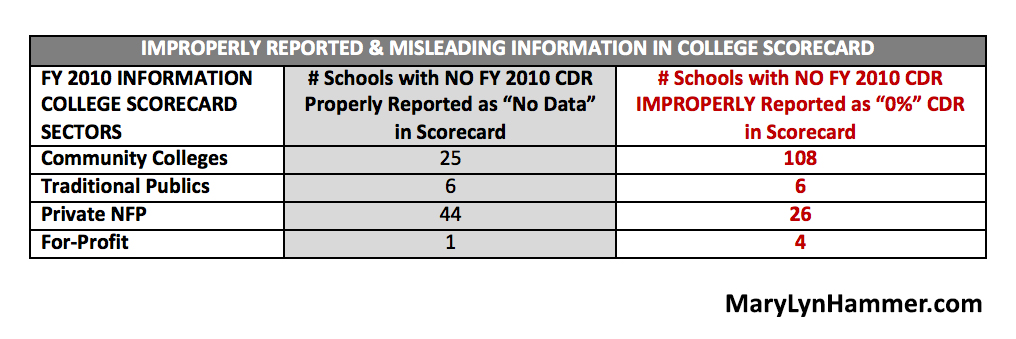
- Many schools had false and misleading information. For example, certain schools that didn’t have FY 2010 CDRs had “0%” instead of “No Data” in the Scorecard. This falsely implies “high quality” and gives the impression that no students from this college defaulted.
- After Mary Lyn Hammer began to speak up about these errors in January 2015 (with ED employees present) the data from the College Scorecard website was mysteriously removed. Hammer has attempted to determine the exact date that Scorecard data was removed using several companies that archive snapshots of websites.
a. Two sites shut down when the College Scorecard URL was entered and therefore couldn’t show anything. These were:
b. The Wayback Machine website last archived the College Scorecard site on February 13, 2015, only 2 weeks after Ms. Hammer first raised the issue of errors. The information is available at the following link: https://web.archive.org/web/20150213214414/http://www.whitehouse.gov/issues/education/higher-education/college-score-card.
c. At this time, Ms. Hammer can only verify that erroneous College Scorecard data was available on February 13, 2015 but was deleted by March 18, 2015. Approximately 20 ED employees were present during Ms. Hammer’s speech on February 23, 2015.

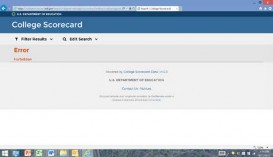
The “NEW” College Scorecard in September 2015
In September 2015, ED released a “new and improved” College Scorecard to help parents and students make informed decisions about college choices. When it was unveiled, Ms. Hammer began to download the Scorecard data to analyze accuracy. When Ms. Hammer attempted to review the data—she immediately received the following message:
Error: Forbidden
Ms. Hammer finds it troubling and deeply concerning that she cannot gain access to the data used in the College Scorecard. She has spoken to several public people and they have access to the information. If the information is accurate, why is ED blocking Ms. Hammer from the data?
The College Navigator Provides Comprehensive Data for All Schools
At the end of 2014, when Ms. Hammer was completing her research and analysis of publicly available college information, she had to manually collect financial information. While ED’s College Navigator appears to have the most comprehensive data and contains many pertinent data points, some of the information is not clearly defined and assumptions are made in the Navigator data that may not be accurate. For example, a college’s average student loan debt is provided in Navigator —but that data does not come anywhere close to ED’s reported 2014 national average student loan debt of $28,400. Because Navigator’s student loan debt amounts are significantly lower than the national average, perhaps Navigator uses academic year amounts, not a cumulative debt amounts. Cumulative debt amounts would be more helpful in student and lawmaker decision making.
Further, most of Navigator’s information is not readily available. A comprehensive report of all schools (or even by sector) cannot be generated. Reports must be pulled in batches and do not contain any financial information—pertinent to decision making. When Ms. Hammer analyzed the data, she had to pull batches of information for all sectors and then add financial information manually.
A Review of the College Navigator Data Shows:
- For-profit schools serve the largest population of Pell Grant (at-risk students) recipients at 62.6%. When coupled with for-profit college’ FY 2011 3-year average CDR rate of 18.9%, one can see that for-profit college did a fantastic job of helping at-risk students make timely payments or exercise their rights of deferment and forbearance during the worst economic period since the Great Depression.
- Community colleges serve a lower percentage of at-risk students with 42.7% in Pell Grant recipients. Yet community colleges have higher FY 2011 3-year average CDR rates of 20.4%. This indicates that community colleges do a poorer job helping their students avoid default when compared to the for-profit sector. This doesn’t mean that community colleges are bad—it just shows that they lack the budget, staff, or focus needed to help students avoid defaults.
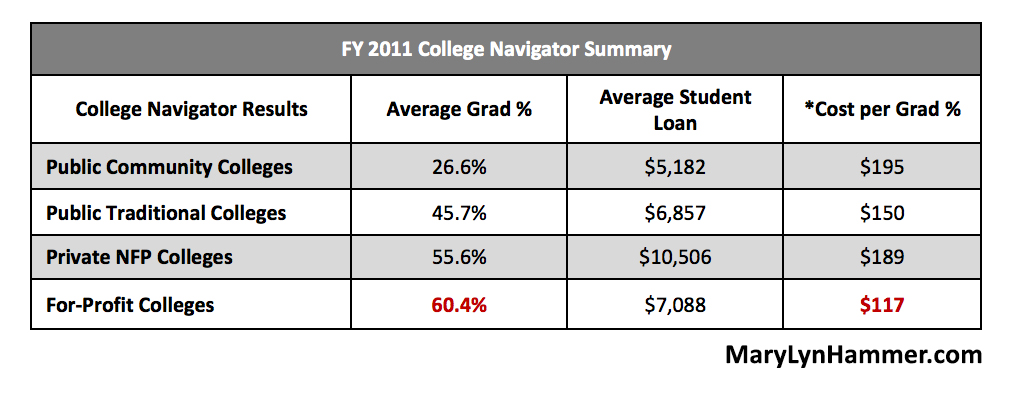
- The graduation rate for for-profit college is the highest of all sectors at 60.4%. The graduation rate at public colleges is the lowest at 45.7%. Public community colleges have the lowest overall graduation rate at 26.6%.
- When looking at Pell Grant and Federal Student Loan funds by sector, using the average recipient amount divided by the graduation rate (or how much taxpayer money does it take for the average graduate) one finds the following:
- Community College Pell Grant Cost Per Graduate is the highest at $139.54;
- Community College Student Loan Cost Per Graduate is the highest at $194.82;
- For-Profit College Pell Grant Cost Per Graduate is the lowest at $64.36;
- For-Profit College Student Loan Cost Per Graduate is the lowest at $117.35;
There are other pertinent facts from the College Navigator data:
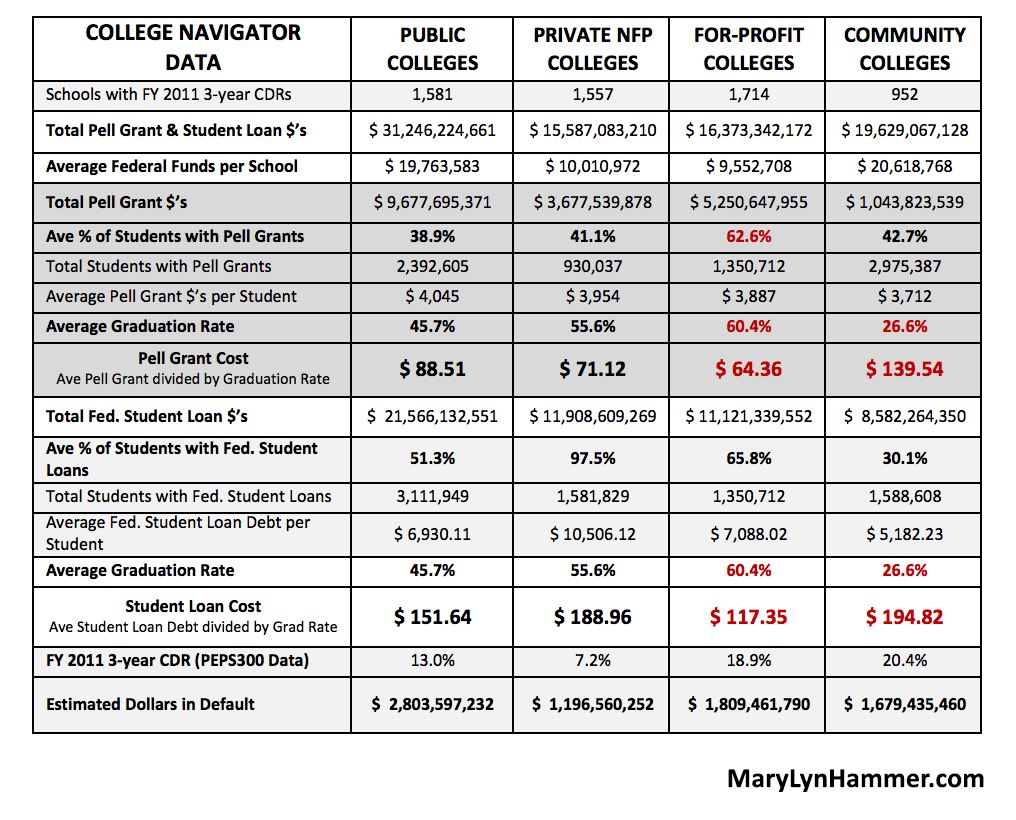
The data shows that for-profit college outperform all other sectors in terms graduation rate and lowest cost to student borrowers and its loan amounts are reasonable especially considering that higher loan amounts would be consistent with higher graduation rates.
If the reporting, analysis, and data availability were structured so that this important information was readily available—misinformation could be mitigated. Currently, only four data points are available in College Navigator reports and it is very cumbersome to obtain all of this limited information.
Decisions by lawmakers, regulators, parents, and students must be based upon true data and not on manipulated data and reporting designed to drive certain political or philosophical agendas.
Not every student wants or is prepared to go to a public college. Low-income, at-risk students generally need more attention and more guidance from a higher education provider. This type of attention and guidance is regularly provided at for-profit institutions.
An institution’s tax-filing status should not be a factor in measuring the quality of education. Let the data speak for the quality. The data is available—Americans just need access to it.
Conclusion
ED’s true data demonstrates that there are MANY high-quality, high-performing for-profit colleges.
At best, the numerous, and repeated errors in ED’s “reported” sector-level performance data is evidence of gross negligence. At worst, ED’s reporting of erroneous data is evidence of direct manipulation aimed at advancing an agenda against for-profit institutions—an agenda that has nothing to do with quality education.
While some schools—in all sectors—should come under higher scrutiny, most for-profit institutions provide quality education options especially for at-risk students in fields where important job training is needed and not being fulfilled by any other higher education sector.
So, in answer to the question of whether for-profit colleges are awful or abused?
The answer is ABUSED!

Mary Lyn Hammer is an expert resource for journalists who need reliable answers to tough questions about how the U.S. government handles student loans, cohort default rates, higher education loan regulations, and the topics of financial literacy and education legislation.
For more information, to obtain a review copy of Injustice for All, schedule an interview, and/or to book Ms. Hammer to speak to your group, please call 480.222.4314 or click here to email your request.
