
Shock-ED
Some of the shocking reasons why education reform MUST happen…

We must ensure freedom of educational choice!
Shock-ED represents the taxpayer’s queasy reaction upon realizing the deception from the U.S. Department of Education (ED or DOE) data and reporting with sometimes blatant and sometimes subtle disregard of facts; databases that mysteriously disappear; and underreporting, misreporting, or just not reporting at all.
CEO of Champion College Services, Mary Lyn Hammer has almost three decades of experience in the education industry. She is the preeminent expert on cohort default rate management, has assisted in DC on Capitol Hill by drafting legislative language, on Rulemaking committees and as an education advocate for students and schools. What she has uncovered and documented in a special 312-page report titled “Injustice for All” is SHOCKING evidence of what appears to be the DOE moving two agendas forward:
-
eliminated the private-sector Federal Family Education Loan Program (FFELP) for federal student loans and falsely or underreported loan program performance to cover up ED’s poor performance for managing the student loan program that included several hundred thousand defaults that never should have occurred and have wrongly tarnished the financial standings for students while ED was ranked the third most profitable company in America in 2013; and
-
pushed on-going smear campaigns with deceptive data and reporting that has falsely tarnished many for-profit proprietary institutions’ reputations and caused Americans to believe that public institutions—with the same average default rates, lower graduation rates, and exemption from quality standards like gainful employment—are the best option for education.
The following audited Shock-ED Facts tell the truth about the annihilation of our higher education ideals that, if not stopped, will lead to an increasing dependency of citizens on entitlement programs because they lack skills, training, and self-esteem needed to support a strong future for Americans.
![]()
What Documents and Data Were Examined?
|
Summary of Documents and Data Examined |
|||
|
Reference Document |
Reference Description |
Does the related reference document or reported data MATCH the actual data? |
Is this information still available? |
|
2012 DOE Briefing for FDSLP FY 2009 3YR CDR |
2012 Official Default Rates for Direct Loans |
No |
No |
|
2012 DOE Briefing for FFELP FY 2009 3YR CDR |
2012 Official Default Rates for Private Lenders |
No |
No |
|
2012 DOE Briefing for FDSLP & FFELP Rates |
2012 Official Chart for FDSL and FFELP CDRs |
No |
No |
|
2012 “Top 100 Loan Holders” Information for FY 2009 3YR |
List of Top 100 Loan Holders by Volume Ranking |
The information provided is limited in nature and matches the data. |
No |
|
2012 GE “Streamlined” Informational Rates |
The “short list” of GE program rates reported to the public |
Inaccurate and incomplete |
No |
|
2012 GE “Final” Informational Data |
Unpublished “comprehensive data” for all GE programs |
Inaccurate and incomplete |
Yes—renamed without “final” |
|
June 26, 2012 GE Webinar |
Video Recording of Webinar |
No |
No |
|
2013 DOE Briefing for FDSLP FY 2010 3YR CDR |
2013 Official Default Rates for Direct Loans |
No |
No |
|
2014 DOE Briefing for FY 2011 3YR CDR |
2014 Official Default Rates for All Sectors & Credential Levels |
No |
Yes |
|
2014 Official 3YR PEPS300 Data (FY 2009, 2010 & 2011) |
Comprehensive Data for Institutional CDRs |
n/a |
Yes |
|
2014 Official FY 2009 Lender Data |
FY 2009 3-year CDR data for loan holders |
No |
No |
|
2014 Official FY 2010 Lender Data |
FY 2010 3-year CDR data for loan holders |
No |
Yes |
|
2014 Official FY 2011 Lender Data |
FY 2011 3-year CDR Data for Loan Holders |
No—FDSLP Loans are not included |
Yes |
|
2014 “Top 100 Loan Holders” Information for FY 2011 3YR |
FY 2011 3-year CDR Information for Loan Holders |
The information provided is limited in nature and matches the data. |
No |
|
2014 GE FY 2012 Informational Rates |
FY 2012 GE Informational Rates released with GE 2.0 NPRM |
Inaccurate and incomplete |
No |
|
2015 DOE Briefing for FY 2012 3YR CDR |
2015 Official Default Rates for All Sectors & Credential Levels |
No |
Yes |
|
2015 Official 3YR PEPS300 Data (FY 2012, 2011 & 2012) |
Comprehensive Data for Institutional CDRs |
n/a |
Yes |
|
2015 Official FY 2012 Lender Data |
FY 2012 3-year CDR Data for Loan Holders |
No—FDSLP Loans are not included |
Yes |
|
2015 “Top 100 Loan Holders” Information for FY 2012 3YR |
FY 2012 3-year CDR Information for Loan Holders |
The information provided is limited in nature and matches the data. |
Yes |
|
College Navigator |
Website where students and parents can collect information |
Reports do not contain financial & other pertinent information & it takes manual labor to collect data |
No – Currently shows 2013–2014 data |
|
College Scorecard—Original |
Website where students and parents can collect information |
Inaccurate and incomplete |
Original—No |
|
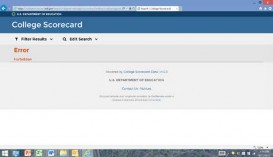
College Scorecard—2015 |
Website where students and parents can collect information |
Inaccurate and incomplete |
2015 Search Results: Error Forbidden |
These facts and more are documented within Injustice for All—backed by Mary Lyn Hammer’s expert analysis of publicly available data and reports and verified for accuracy in “Independent Accountants’ Reports” conducted by Kaiser & Carolin, P.C.
![]()
11 Shock-ED FACTS from Injustice for All
The DOE must correct this error.
Shock-ED #1 For the last four years, certain federal student loan (conduit) portfolios purchased from the private sector are now managed by ED and have had default rates well above the national average with some just under 60%. ED ruined the financial standing of several hundred thousand student borrowers during these conduit purchases and the transition to 100% direct lending by mismanaging these students’ loans. Many of these students were actually in good standing on their loans when they were transferred from private lending agencies to the federal government’s management and were almost immediately put into default because the current status didn’t properly transfer. When Ms. Hammer notified ED of these colossal errors right when they began occurring, ED did not correct this problem and allowed the financial reputations of these students to be ruined. Additionally, colleges have suffered consequences and tarnished reputation from default rates based on these defaults that wrongly occurred.
|
FISCAL YEAR |
PORTFOLIO |
# DEFAULTS |
CDR % |
NATIONAL iCDR % |
|
FY 2009 |
2008-2009 LPCP |
148,171 |
21.2% |
13.4% (13.5% correct calculation) |
|
2007-2008 STPP |
19,598 |
27.1% |
||
|
2009-2010 LPCP |
1,294 |
54.3% |
||
|
ABCP CONDUIT 09-10 |
26,774 |
59.8% |
||
|
FY 2010 |
2009-2010 LPCP |
148,636 |
18.2% |
14.7% |
|
ABCP CONDUIT 09-10 |
25,433 |
56.7% |
||
|
FY 2011 |
ABCP CONDUIT 09-10 |
14,455 |
58.6% |
13.7% |
|
UNREPORTED FDSLP PORTFOLIO |
238,812 |
30.4% |
||
|
FY 2012 |
ABCP CONDUIT 09-10 |
3,916 |
56.0% |
11.8% (11.9% correct calculation) |
|
UNREPORTED FDSLP PORTFOLIO |
424,976 |
15.9% |
NOTE: ED miscalculated numerous cohort default rates in its Official National Briefings. We have provided the published rate and the correct calculation.
![]()
Shock-ED #2 ED misreported loan program performance by either reporting its own default rates lower than data shows and the private-sector FFELP default rates higher than data shows or by not reporting direct loan default rate information at all. Is this is an attempt to cover up ED’s own poor performance and mismanagement of the student loans?
|
FY 2009 LOAN PROGRAM COHORT DEFAULT RATES |
|||||||
|
ED-REPORTED LOAN PROGRAM CDRs |
ACCURATE LOAN PROGRAM CDRs BASED ON DATA |
||||||
|
Source |
# Defaults |
# Repay |
CDR % |
Source |
# Defaults |
# Repay |
CDR% |
|
2012 Briefing FDSLPFY 2009 |
66,028 |
764,662 |
8.6% reported |
2014 FY 2009 Lender Data |
195,884 |
819,332 |
23.9% actual |
|
2012 Briefing FFELPFY 2009 |
425,651 |
2,912,027 |
14.6% reported |
2014 FY 2009 Lender Data |
295,355 |
2,785,365 |
10.6% actual |
For the FY 2009 3-year loan program cohort default rates released in September 2012, approximately 130,000 defaulted borrowers were reported under the FFELP default rate when they actually belonged to the FDSLP default rate—there was only 440 borrowers’ difference. Is it just a coincidence that the totals for the briefings and the loan program data were virtually the same?
|
FY 2009 Information Source |
Borrowers in Default |
Borrowers Entered Repayment |
|
TOTAL of FDSLP & FFELP Briefings |
491,679 |
3,676,689 |
|
TOTAL of FDSLP & FFELP Data |
491,239 |
3,604,697 |
Similar patterns of misreporting and underreporting have been documented for loan program CDRs for FY 2010 – FY 2012. The truth is that even with diminishing returns, the FFEL Program is performing much better than the FDSLP and portfolios managed by ED.
|
FISCAL YEAR |
NATIONAL iCDR |
DOE CDR |
FFELP CDR |
|
FY 2009 |
13.4% (13.5% correct) |
23.9% |
10.6% |
|
FY 2010 |
14.7% |
16.5% |
9.6% |
|
FY 2011 |
13.7% |
15.0% |
9.1% |
|
FY 2012 |
11.8% (11.9% correct) |
12.2% |
8.6% |
NOTE: ED miscalculated numerous cohort default rates in its Official National Briefings. We have provided the published rate and the correct calculation.
Shock-ED #3 Student loan debt is $1.47 trillion, or 9% of overall U.S. debt of $17 trillion.
The accrued and unpaid interest from income-driven repayment plans like Obama’s PAYE and REPAYE programs is capitalized and is contributing to the skyrocketing student loan debt in this country.
Additionally, Obama’s gainful employment regulations primarily punish for-profit institutions when these students are approved for these programs—and they aren’t paying down principal on their loans. Yet, there are no consequences to the majority of programs offered at public and non-profit private institutions when their students are in negative amortization.
![]()

The actual profit of the U.S. government on student loans in 2013 was $41.3 billion and those earnings were only surpassed by the profits of Exxon Mobil ($44.9 billion) and Apple ($41.7 billion)
Shock-ED #4 While the federal government projected earnings (profits) on student loans at $100 billion over 10 years, actual profit for 2013 alone was $41.3 billion, only surpassed by Exxon Mobil ($44.9 billion) and Apple ($41.7 billion). With student loan profit rising at the current growth rate, this means the government will earn over HALF A TRILLION DOLLARS in a ten-year period. And this venture hasn’t saved taxpayers money… and Obama’s Administration knew that all along.
2010 CBO Report: Costs and Policy Options For Federal Student Loan Programs
“Taking into account the costs of risk and administration has the effect of significantly increasing the estimated cost of both the direct and guaranteed loan programs; it also narrows—but does not eliminate—the cost difference between the two programs. For instance, CBO recently estimated that whereas loans issued in the direct loan program between 2010 and 2020 would reduce the deficit by a total of $68 billion under FCRA accounting, those loans would increase the deficit by $52 billion on a fair- value basis. For loans issued in the FFEL program, the projected cost over that period increases from $22 billion under FCRA accounting to $105 billion on a fair-value basis. The savings from implementing the President’s proposal to replace FFEL loans with direct loans decline from a total of $62 billion over the 2010–2020 period under FCRA accounting to $40 billion on a fair-value basis.” (i.e. net cost is an additional $22 billion to replace FFELP)
Shock-ED #5 For the last two years and without Congressional approval to change the legal mandates, ED ignored statutory definitions and “adjusted” the default rates of some schools, then refused to provide a complete or accurate list of which schools’ rates were adjusted. ED only adjusted rates for those schools in jeopardy of losing federal funding. Certain non-profit schools knew about the adjustment before the announcements were made and had press releases already written. Other for-profit schools were not notified of the adjustments in advance and were unjustly forced out of business.
Was this an attempt to keep these schools from performing loan servicing appeals that would reveal the tragedy that had unfolded for several hundred thousand students with defaulted loans that never should have occurred? If this was an important issue, why hasn’t ED corrected the problem for hundreds of thousands of students living with the consequences of defaulted loans and all institutions affected?
Shock-ED #6 For the last four years of cohort default rates (CDR) analyzed, the DOE’s “national official” briefings have not matched the institutional CDR data. Patterns show that the public sector numbers have been reported lower than the data shows and the proprietary sector numbers have been reported higher than the data shows. Until 2015, the private sector numbers matched but have been reported lower than the data shows for the FY 2013 CDR. It appears that ED is manipulating numbers to fit their agenda, not to accurately report school performance.
|
ED OFFICIAL iCDR BRIEFING INFORMATION |
PUBLIC SECTOR |
PROPRIETARY SECTOR |
||
|
% DIFFERENCE FROM iCDR DATA |
# DIFFERENCE FROM iCDR DATA |
# DIFFERENCE FROM iCDR DATA |
% DIFFERENCE FROM iCDR DATA |
|
|
FY 2009 3-YR iCDR |
-4% |
-8,700 |
+20,353 |
+10% |
|
FY 2010 3-YR iCDR |
-3% |
-9,031 |
+21,277 |
+8% |
|
FY 2011 3-YR iCDR |
-4% |
-11,276 |
+12,332 |
+4% |
|
FY 2012 3-YR iCDR |
-2% |
-8,034 |
+20,504 |
+10% |
Why is this important? Because the story the REAL data tells is not consistent with Obama’s or ED’s stories or their agenda. For example, for the FY 2012 iCDRs, the public sector actually had 91,553 MORE defaults than the proprietary sector which represents 51% of all defaults, up from 32% of total defaults for the FY 2009 3-year iCDR. Is it more likely that this misreporting was intended to prevent news headlines like: public colleges represent almost 100,000 more student loan defaults than for-profit colleges?
For FY 2012 iCDRs, data shows that the proprietary sector default rate is actually 15.4%, not the 15.8% rate that ED published. The for-profit sector percent of total has declined from 44% for FY 2009 to 36% for FY 2012.
![]()

ED deserves the grade of F in statistical reporting.
Shock-ED #7 ED has misreported debt-to-earnings rates for both for-profit proprietary institutions and for public institutions. The DOE appears to have manipulated data to eliminate reporting for most non-profit programs (less than 5% reported) and to show lower debt-to-earnings rates at public institutions and higher debt-to-earnings rates at for-profit institutions than data actually shows. The original gainful employment (GE) “final” data shows that ED grossly exaggerated the annual payments for most pro- prietary programs—and when the payments were properly calculated, there were only 6 failing proprietary programs, not the 193 that the DOE reported. Since 56 of these failing programs would fall within the “zone” eligibility criteria, this is likely the catalyst for the less-forgiving second round of gainful employment regulations. The misreported gainful employment information swayed public opinion in favor of non-profit schools and against for-profit proprietary schools when most non-profit schools are not held to the same quality standards.
|
ORIGINAL GAINFUL EMPLOYMENT |
ED REPORTED # PROGRAMS FAILED ALL 3 METRICS |
ACTUAL FAILED PROGRAMS USING CORRECT REPAYMENT SCHEDULE CALCULATIONS |
# ORIGINAL FAILED PROGRAMS THAT FALL WITHIN GE 2.0 ZONE |
|
FY 2011 |
193 |
6 |
56 |
FY 2012 GE Information Rates: ED did not include the “median debt” needed to verify the accuracy of the FY 2012 gainful employment informational rates released with the notice of proposed rulemaking for gainful employment 2.0 published in March 2015. Could this lack of transparency be another indicator of inaccurate and manipulated GE rates?
Shock-ED #8 The original College Scorecard hosted on whitehouse.gov did not include all schools, was missing information for many of those that were reported, and included misleading information for others. This data was removed from the website within a month of Ms. Hammer’s first speech about the inaccurate information ("This page can’t be displayed"). The 2015 College Scorecard data released in September 2015 became unavailable. ("Error: Forbidden") Well, at least, that’s the error code that Ms. Hammer gets when seeking information from the new College Scorecard.

Shock-ED #9 The College Navigator hosted by ED provides extensive information about schools but the downloadable reports exclude all financial information and are not available in an inclusive data set—the information must be pulled manually to see that the proprietary sector represents the highest graduation rates at the lowest student loan costs for students. Again, is this lack of transparency another way to cover up the truth about sector-level performance?
Ms. Hammer manually collected the 2010 academic year financial data available in the College Navigator at the time that Injustice for All was written. She took the sector-level average student loan amount divided by its average graduation rate to get an apples-to-apples comparison of the *cost of student loans for students per graduation percentage.
|
College Navigator Results |
Total # Schools |
Average Grad % |
Average Student Loan Amount |
*Cost of student loans per Grad % |
|
Public Non-Community Colleges |
700 |
45.6% |
$6,856.89 |
$150.37 |
|
Community Colleges |
1,181 |
26.6% |
$5,182.23 |
$194.82 |
|
Private |
1,961 |
55.6% |
$10,506.12 |
$188.96 |
|
Proprietary |
3,732 |
60.4% |
$7,088.02 |
$117.35 |
The FACTS in this difficult-to-obtain data show that the proprietary sector is the highest performing sector with a 60.4% graduation rate provided at the lowest student loan cost of $117.35 per graduation percentage for students. Is this the reason why the financial information is not available in the College Navigator standard reports or in any database?
Shock-ED #10 AND THERE’S MORE…Extensive evidence is documented in the 312-page special report Injustice for All. This many errors in reporting cannot be coincidental. Is the inaccurate reporting across many federal higher education databases and used to assault and defame proprietary schools actually a deflection from the DOE’s own poor performance of higher education?
![]()

Is it possible that our children will have nowhere to go to receive a QUALITY higher education?
Shock-ED #11 Americans are quickly losing their freedom to choose which college they want to attend and are being forced into public education systems that are often substandard under the promises of “free” education. Many proprietary schools provide valuable training that is critical to the American economy through trades like welders, electricians, the medical industry, auto mechanics, cosmetology careers and more. If proprietary schools are eliminated, many students will be on the street or have limited options for educational training.
Here are some FACTS about the quality of public and proprietary sector performance based on institutional cohort default rates. While there are some colleges in every sector of higher education that need to be held accountable for breaking rules and laws, the two sectors below show almost identical statistics for good quality indicators— something that the DOE has worked very hard to keep out of the public’s eye.
|
FY 2012 iCDR QUALITY INDICATOR FACTS |
||||
|
SECTOR |
GOOD QUALITY (LESS THAN 15% iCDR) |
BAD QUALITY (OVER 30% iCDR) |
||
|
# COLLEGES |
% COLLEGES |
# COLLEGES |
% COLLEGES |
|
|
PUBLIC |
909 |
58.0% |
6 |
<1% |
|
PROPRIETARY |
930 |
57.3% |
18 11 after adjustments |
1.1% <1% after adjust |
These facts and more are documented within Injustice for All—backed by Mary Lyn Hammer’s expert analysis of publicly available data and reports and verified for accuracy in “Independent Accountants’ Reports” conducted by Kaiser & Carolin, P.C.

Additional compelling evidence on these shocking facts can be found in the 312-page special report, Injustice for All. Get the report here or call 480.222.4314.
![]()
THE CATALYSTS FOR INVESTIGATING DOE DATA & REPORTING
December 28, 2015
 In September 2014, the U.S. Department of Edu- cation (DOE) released the national official cohort default rates (CDRs) as it is mandated to do; however, the DOE issued them with “adjustments” to the rate calculations that are defined by law and with “acceptance” to appeal circumstances that were never allowed before and, then, only applied these exceptions to certain schools in jeopardy of losing Title IV federal funding. Immediately it appeared that this was a carve-out for the Historically Black Colleges and Universities (HBCU) and the community colleges, particularly when the DOE refused to provide a detailed list of those with adjustments. Mary Lyn Hammer immediately knew that something was terribly wrong especially considering the fact that lawmakers had not approved any changes to the laws that define CDRs.
On September 22, 2014, when the 2014 Official FY 2009-2012 CDRs were released to higher education institutions, Ms. Hammer received a call from a client who owned an inner-city school in Erie, Pennsylvania. Ms. Hammer’s company and her client had tried to get the school’s default rates under the 30% allowable threshold through appeals without success and she had begun the process of closing her school on July 1, 2014. That school did everything right. It stopped pulling down funds; it notified their students; it found other schools to “teach out” the programs for students who could not graduate by
the end of the year; and it terminated the positions of all administrative staff and teachers who weren’t essential to graduating those who it could before the client closed the school at the end of December 2014. This client could not find teach-out solutions for 54 nursing students, some who had already invested years into their goal of helping others—54 citizens who had broken hearts and shattered dreams because they had nowhere else to go and finish their education. On September 22nd, Ms. Hammer’s client received a letter from the U.S. Department of Education notifying that the school actually had three consecutive CDRs under 30% after the DOE made its “adjustments.” However, it was too late for this school to stay in business.
At the time the letter was received, no one understood what it meant because it didn’t match the data for the school’s CDRs. Ms. Hammer’s company and her client made numerous calls and sent several emails to the default management group at the DOE and did not receive any communication in return.
On September 23, 2014, the DOE publicly announced that it had made “adjustments” to the CDRs for those schools in jeopardy of losing Title IV federal funding. That morning, the HBCU and community college organizations had press releases ready to go when the DOE made its announcement. Those school groups knew about the adjustments long before they were made—but, the proprietary school that no longer needed to go out of business was never told.
Over months with numerous phone calls with both the federal and regional offices of the DOE, no one told Ms. Hammer’s client that her rates would be adjusted, that all three rates would be under the 30% threshold for federal funding eligibility, and that she wouldn’t have to go out of business. And, in December 2014, after 150 years in business, Ms. Hammer’s client celebrated the school’s last graduating class and closed her doors.
